Configuring Node Exporter for Your Server
In this article, we will show you how to configure Node Exporter for your server.
Node Exporter: Prometheus exporter for hardware and OS metrics exposed by *NIX kernels, written in Go with pluggable metric collectors.
1. Installing and running the Node Exporter in your server
In Linux Server
Node IP: x.x.x.x
Download the node exporter file from the Prometheus downloads page.
wget https://github.com/prometheus/node_exporter/releases/download/v1.1.2/node_exporter-1.1.2.linux-amd64.tar.gzExtract the file
tar xf node_exporter-1.1.2.linux-amd64.tar.gzRun the file
/root/node_exporter-1.1.2.linux-amd64/node_exporter &Check if the service is running
Check if the service is running by issuing the command
lsof -i:9100Verify Node Exporter metrics
Once the Node Exporter is installed and running, you can verify that metrics are being exported by cURLing the /metrics endpoint:
curl localhost:9100/metrics
In Windows
Please refer to https://github.com/prometheus-community/windows_exporter
2. Add node_exporter to the Prometheus Server
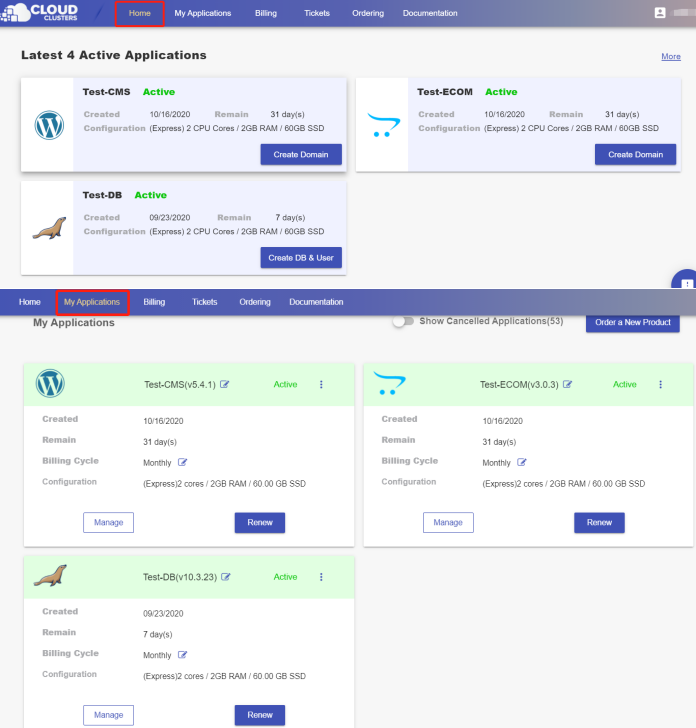
Locate the target deployment
Log in to the Control Panel and locate your target deployment on the Home page or the My Applications page.
Launch a shell session
Click the Manage > Shell / SSH tab button to go to the Shell / SSH page.
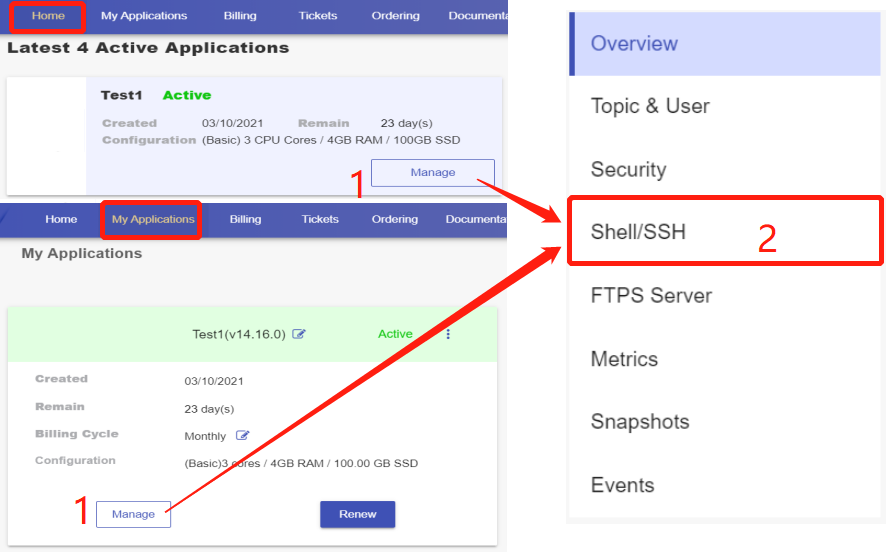
Click the “Connect” icon to reboot the service launch a shell session.
Configure Prometheus
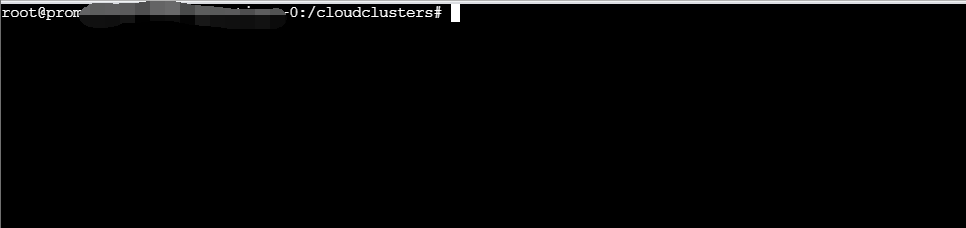
Edit prometheus.yml, the configuration file, to add a new job in the scrape_config section.
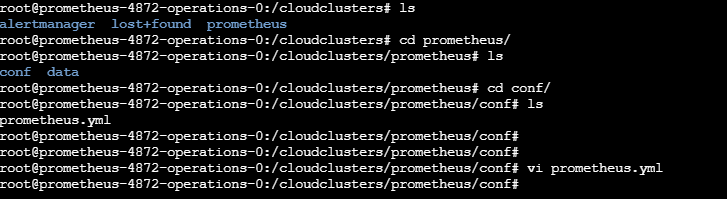
As the above screenshot shows, the configuration file is located in /cloudclusters/prometheus/conf/. Use the command below to go to the editing interface.
vi /cloudclusters/prometheus/conf/prometheus.yml
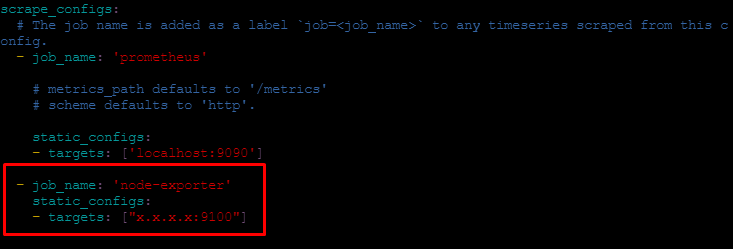
followed by adding the job with the command below.
- job_name: '<your job name>'
    static_configs:
    - targets: ["node ip:9100"]
<your job name> : replace it with your job name.
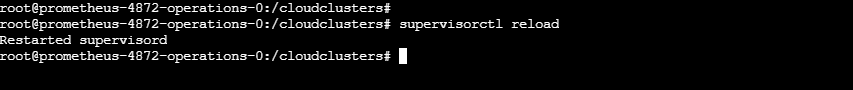
Restart service
The supervisorctl reload command will restart the prometheus service.
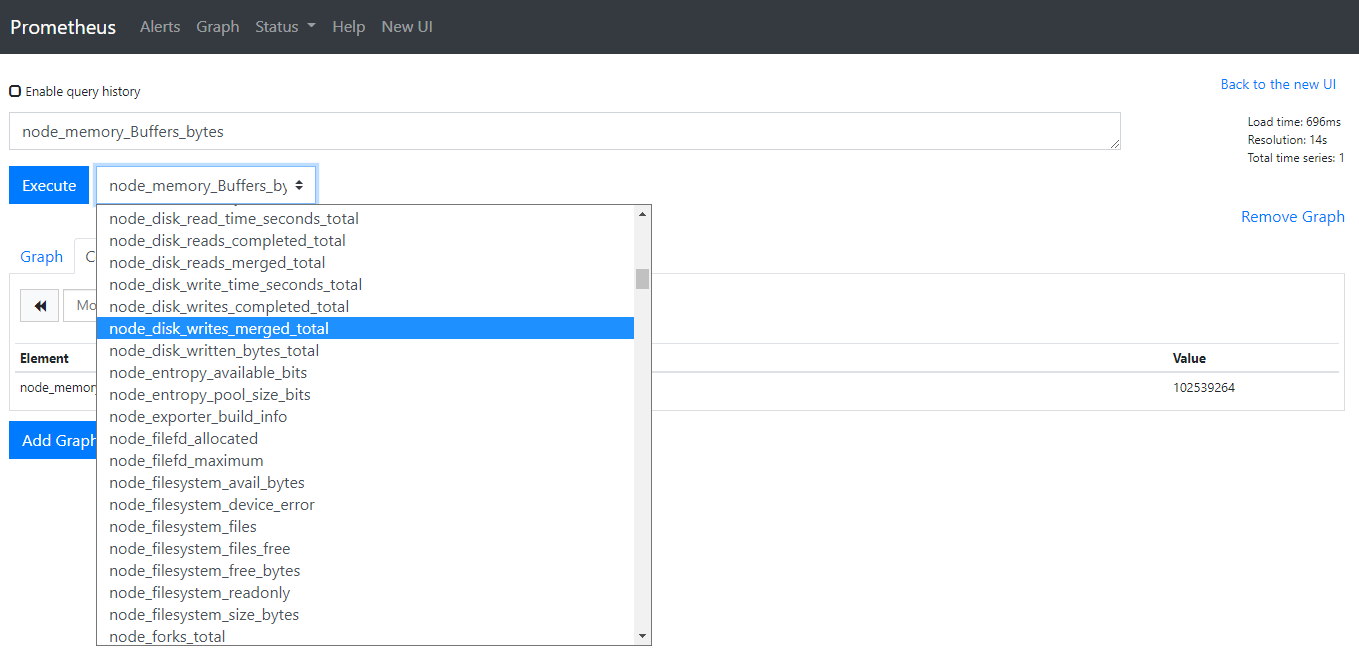
3. Visualize Your Data
Now Prometheus is scraping metrics from a running Node Exporter instance, you can explore those metrics using the Prometheus UI.
Go to the Site & SSL page and click the Prometheus url. Then, enter the user and the password provided on the Site & SSL page.
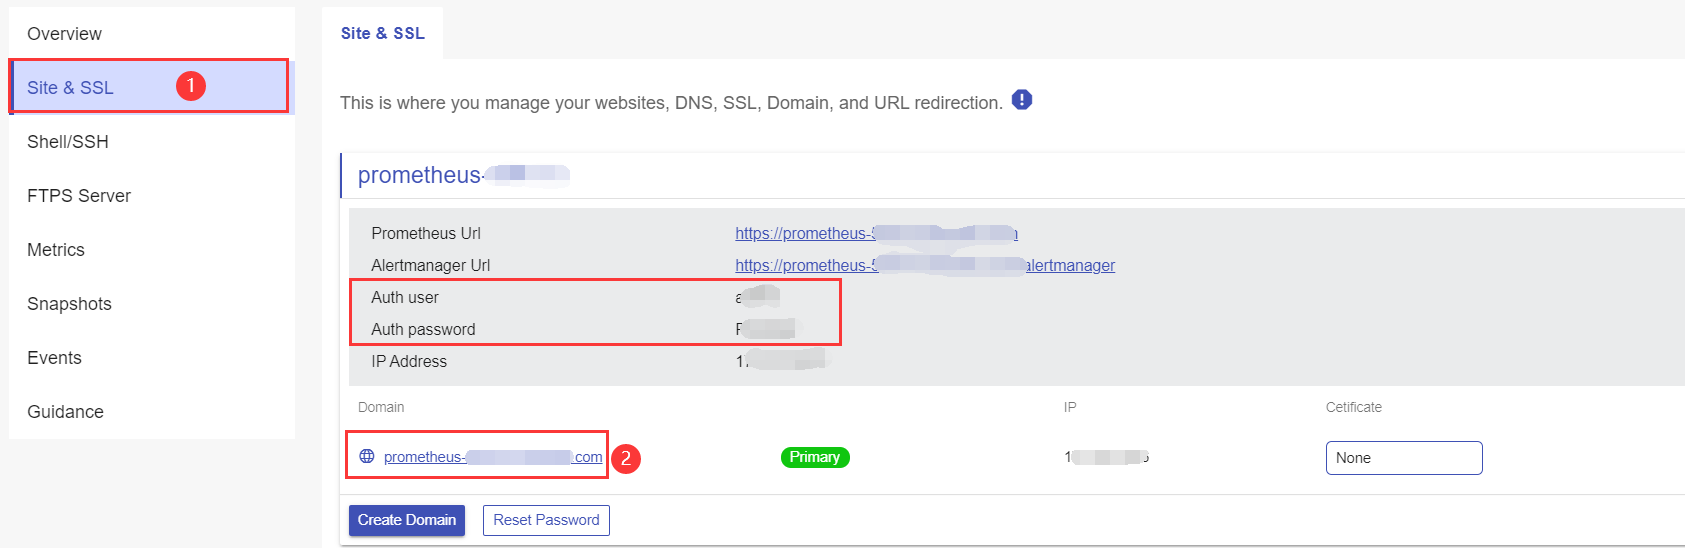
You are able to start visualize your data in graphs.